


6x2 Table Infographics
6x2 Table Infographics
(1 Editable Slide)
Product Details
(1 Editable Slide)
Available For
PowerPoint
Keynote
Google Slides
Animation:
Yes


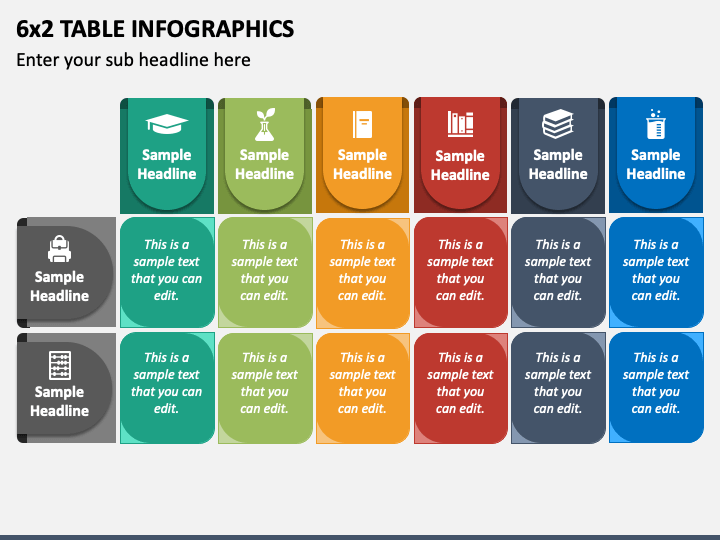
Use our 6x2 Table Infographic slide for Microsoft PowerPoint and Google Slides to give an eye-pleasing look to your presentations. The slide features a tabular illustration of six columns and two rows; each cell is beautified in different background color contrast. It is adorned with appealing icons and provided with editable text placeholders.
Using this multi-use infographic, researchers can portray the summarized survey results, like how different demographic groups respond to a particular product or service. Finance managers can leverage this tabular diagram to present financial information, such as revenues and expenses for different departments or products.
Salient Features
- No user needs knowledge of special tools to modify the graphic.
- The illustration maintains its exceptional quality, even when showcased on a larger screen.
- The users won’t encounter copyright issues, as everything has been designed after thorough research.
- Our customer support executives are available around the clock to address all your queries and concerns.
Download this PPT right away to enrich your presentations!