


Shenzhen Map for PowerPoint and Google Slides
Shenzhen Map for PowerPoint and Google Slides
(7 Editable Slides)
(7 Editable Slides)
Related Presentation Templates


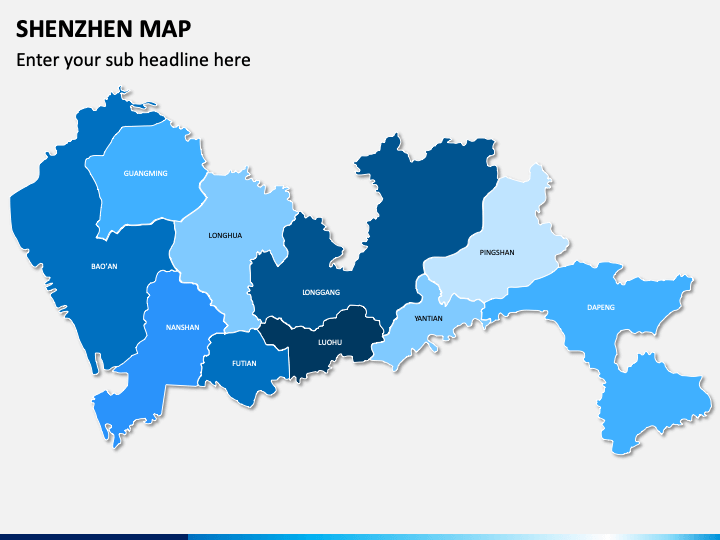
Draft stunning slideshows related to this thriving Chinese metropolitan using our Shenzhen map PPT template. From drafting an informative slideshow to pitching your local clients, this set of extensive maps has got you covered.
About Shenzhen
Commonly known as China’s Silicon Valley, this is one of the biggest cities in the country and is a part of the Pearl River Delta Megalopolis. It is defined as a special economic zone in China and is located adjacent to Hong Kong. It is the home of more than 12 million residents and has an impressive GDP of $361 billion presently. The city is known for its IT and tech industry, being the home of companies like JXD, Tencent, ZTE, Huawei, BYD, Nepstar, and more.
Major Features
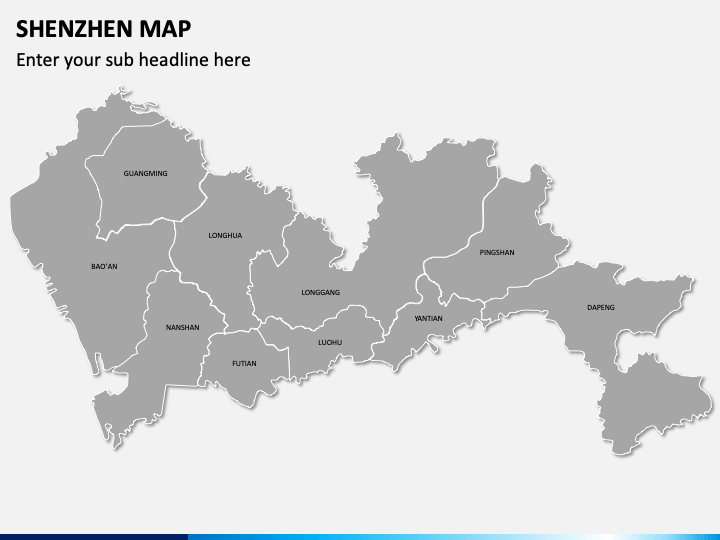
- In this presentation set, you can find different styles of maps related to this region that can be used in various presentation platforms like MS PowerPoint, Apple Keynote, and Google Slides as different files are provided for each platform.
- Using these maps, you can depict the geographical division of the city or even explain your business strategy related to the local points.
- All these slides are entirely editable so that you can easily enter your data or change their appearance.
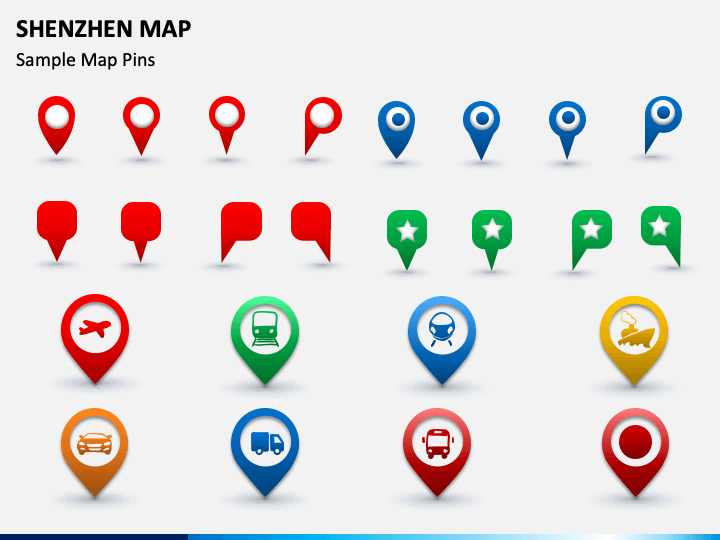
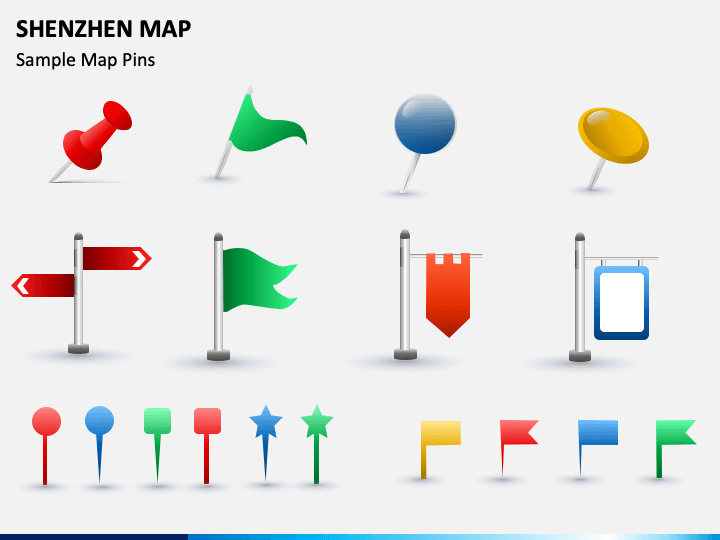
- Furthermore, our designers have included different pins, vectors, flags, etc. in the set that you can use to customize your slides.
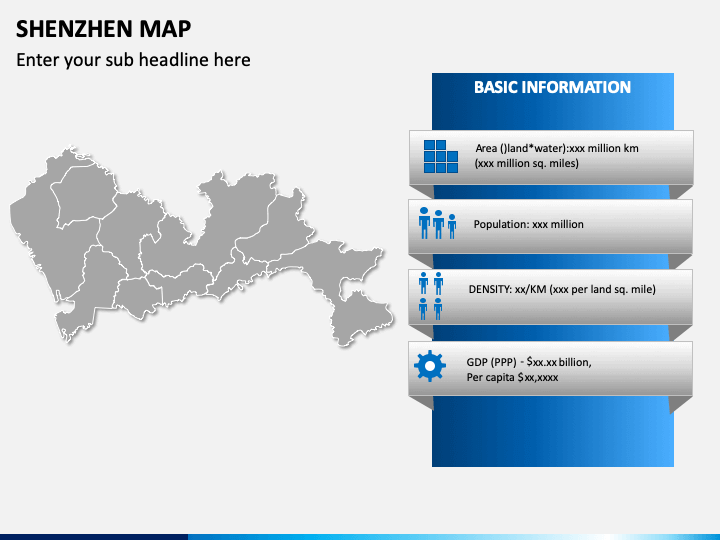
- There are also dedicated slides to help you depict any demographic information related to Shenzhen in a visually appealing manner.
Who can Use it?
If you want to draft stunning slides related to the city of Shenzhen, then this would be an ideal set. It can help you draft informative slideshows about the city, giving you a perfect solution to present your data. You can also use these slides to present your marketing plans, sales strategy, and even pitch local clients seamlessly.
How to Use it?
Once you have downloaded the set, you can use these vectors with applications like Microsoft PowerPoint, Apple Keynote, or Google Slides. You can add your data and change the way these maps look with a few clicks. Besides that, you can also use other vectors included in the set to draft visually interesting slideshows in less time.